
Angels in the Architecture (interlude)
On the limits of 3M's Visual Attention Software in architectural research

[This is a the third in a series of long posts with a lot of images. Read the first installment here and the second installment here. Consider clicking over to the Substack site if the images won’t load fully in your inbox.]

The first two posts in this series each looked at an existing paper employing 3M’s Visual Attention Software and undertook in-depth recreations of the experiments presented. I have a few more papers on hand that I’d like to examine similarly, and those posts are in various stages of completion. While putting those longer posts together I’ve encountered some other lines of inquiry that I want to explore in shorter, simpler ways without a published paper to react to. What follows is the first offering in that category.
3M’s VAS product holds a prominent place in the eye-tracking simulation market, but it’s not the only game in town. Commercial tools like expoze.io, EyeQuant, Attention Insight, and Neurons Predict offer similar visual analysis tools, as do a growing number of open-source and academic models.1
A really strenuous investigation into the factors separating each model would be a worthy undertaking, but that’s outside the scope of what I’m interested in here. It’s also outside the scope of what practitioners interested in employing eye-tracking simulation tools into their work should be expected to figure out.
Each tool works a little differently: in the initial settings available, in how the analysis is performed, and in how the results are presented. But they’re all intended to provide predictions about the behavior of human observers—behavior one assumes is not tied to any one particular manufacturer.
Put another way: similar softwares analyzing the same image ought to arrive at similar results. 3M advertises VAS use as “like having a visual spell-check.” Extending this metaphor, we would expect comparable results in spell-checking a document with Microsoft Word, Apple Pages, and Google Docs, even if the results don’t coincide 100%. If we encountered wide divergences, we would begin to question the reliability of (at least some) automated spell-checking tools.
Three of the tools mentioned above—expoze.io, EyeQuant, and Attention Insight—offer free trials, which offer a foot in the door to run some very preliminary tests in this vein.

Certain resemblances pop out right away in the marketing copy for all of these tools: they use AI and neuroscience, they help you to design, they do this instantly, etc. Digging into the FAQs and explainers for each, it’s clear that they all approach this work from the perspective of print and screen graphics—that is, 2D imagery—not spatial experiences. But the underlying claim of the research under discussion is that eye-tracking simulation is a useful tool for analyzing buildings, so let’s look at some buildings.
I’ve picked the four images below for the sake of this quick experiment. They’re far from representative of all architecture worldwide, but I believe they provide a reasonable range of scales and styles under reasonably good viewing conditions. Each photo is 1500px wide by 1000px tall.

Below are four grids of heatmap results (one grid per building) with labels indicating which software tool was used to generate the output. The heatmaps are unedited except for the addition of the logos in the corners for clarity.


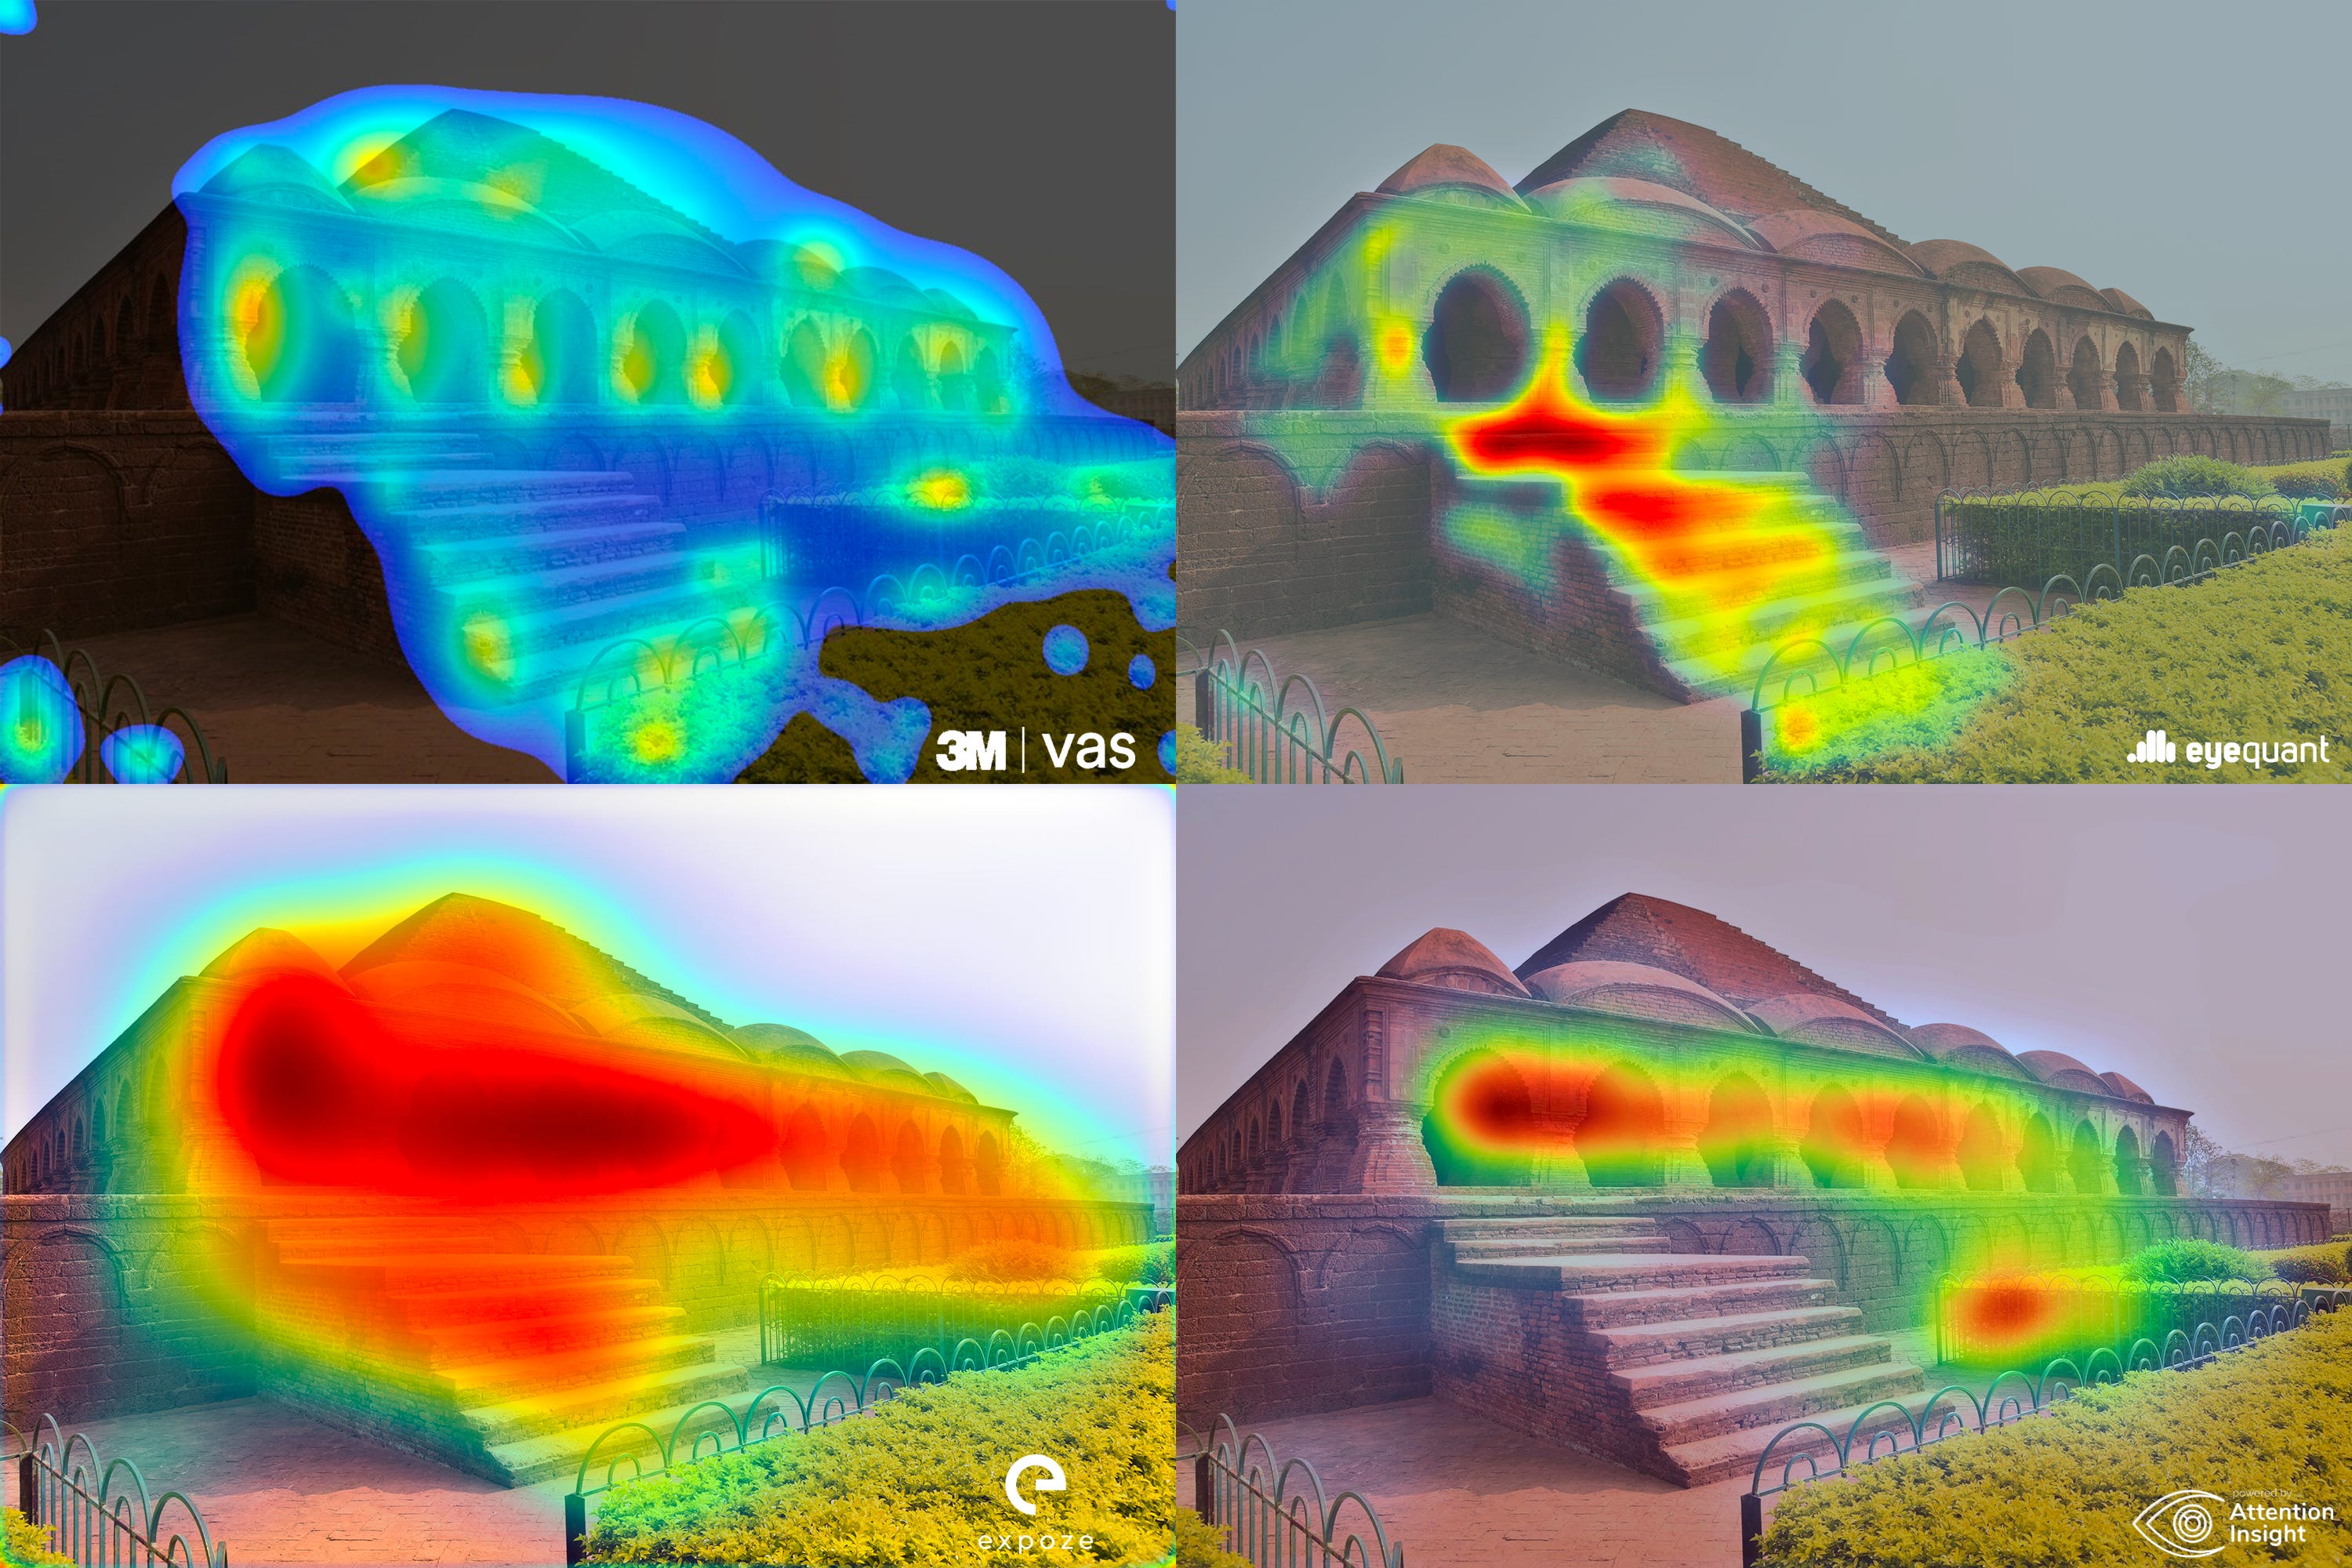
Right away, we can observe some behaviors unique to the output of each particular tool. For instance, the expoze.io outputs predict a much higher incidence of red hotspots than VAS. Similarly, VAS and EyeQuant appear more prone to reporting a fragmenting of attention with many small outliers than the other tools.
Looking at different heatmaps from the same source image, there are some very general concordances, but no real consensus. Areas that Attention Insight identifies as hotspots with the highest likelihood of attracting attention are not picked up the same way by VAS. EyeQuant seems to, for whatever reason, focus far more on doors than the other three.
One objection here is that there’s no standard for heatmap reports in this sort of context. The same pixel (x,y) one tool marks as orange might be colored in as dark red by another, despite sharing the same likelihood of attention in each prediction. That’s a perfectly valid critique and our understanding of the situation would change if we could somehow normalize these results or compare the raw data pre-visualization. That information isn’t available in each tool, so the comparisons we can draw are fairly limited.
But if the question is “do identical inputs into these four tools result in usefully similar outputs?” I think we have to conclude that they do not. Regardless of the specific hue and saturation mapping, the areas of highest intensity aren’t grouped in the same places across the different tools. A design feature which is “engaging” in VAS won’t be evaluated the same way by another tool, even though both claim to be predicting the same thing.
With enough time and data, it would be possible to draw stronger conclusions and map the similarities and differences more rigorously. But this runs counter to the entire sales pitch of these tools, which is that they’re quick, cheap and simple. They all promise, in remarkably similar language, to save clients time and money by forgoing focus groups and testing with live subjects. Researchers employing 3M’s VAS in an architectural context highlight this low barrier to entry as central to their research.
A body of research into “objective beauty” through VAS results will yield different conclusions than that very same research built around expoze.io or EyeQuant analyses. Perhaps drastically different.
I’ll be back in a week or two with a look into a 2021 paper by Ann Sussman, Alexandros Lavdas, and Nikos Salingaros, whose conclusions (*spoiler alert*) are based on VAS analyses alone.
—THA—
Some of the saliency-modeling stuff is not 100% equivalent to what VAS and other commercial tools do, but it does provide the benchmark against which most of them assert their “95% accuracy!” marketing copy, so they’re worth mentioning in this discussion.